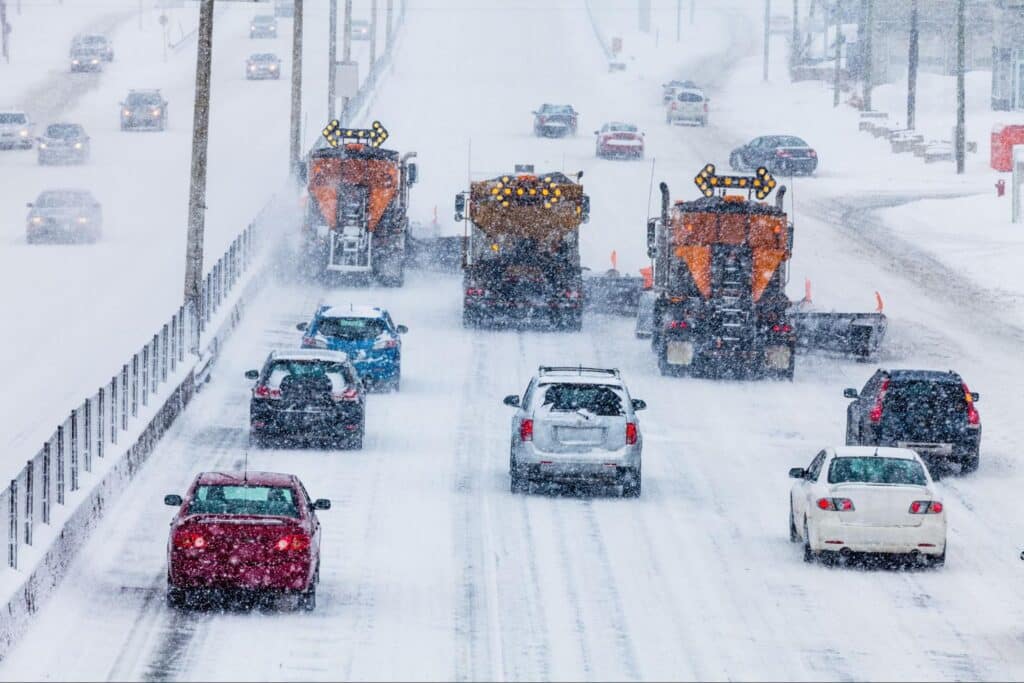
Municipalities face escalating challenges each winter: ensuring public safety on icy roads, managing tight budgets, meeting rising public expectations, and minimizing environmental impacts. Traditional snow and ice management methods—often reliant on extra equipment and manual processes—can be inefficient and costly. Smart, data-driven approaches offer a transformative solution for municipal snow and ice management by integrating technologies—from vehicle tracking and material controls to weather intelligence and reporting—into a cohesive system. This article provides a practical blueprint to modernize winter operations with connected, technology-enabled solutions that optimize workflows and safeguard communities.
Why “Smart Winter Ops” Matters Now
Municipalities must confront three key pressures:
- Budgets: Limited resources demand more effective use of funds, as inefficient practices lead to wasted salt, fuel, and overtime.
- Public Expectations: Communities now expect faster, more reliable service and transparent updates during storms.
- Environmental Concerns: Excessive material usage can harm local ecosystems and strain regulatory compliance.
Relying on outdated, analog methods often results in redundant efforts, overapplication of materials, and reactive decision-making. By transitioning to smart systems, municipal teams shift from mere response to proactive, data-driven operations that improve efficiency, reduce environmental impact, and build public trust.
The Smart Municipal Snow and Ice Management Tech Stack
A modern smart system is built on layers of technology that work together seamlessly:
Layer 1: Vehicle Location and Activity Tracking (AVL/GPS)
Automatic Vehicle Location (AVL) uses GPS to track each snowplow’s location, route progress, and on-road activity in real time. This layer improves operational visibility, reduces redundant coverage, and helps supervisors prioritize critical routes—like hospitals, emergency corridors, and main thoroughfares—during changing storm conditions.
Layer 2: Vehicle Health and Utilization
Telematics monitors vehicle performance—fuel consumption, engine diagnostics, idle times—and alerts teams to maintenance needs. Using innovative telematics solutions minimizes downtime and prevents costly failures during critical weather events.
Layer 3: Material Application Controls
Precise material controls manage both granular and liquid applications:
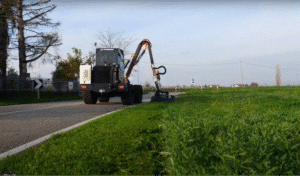
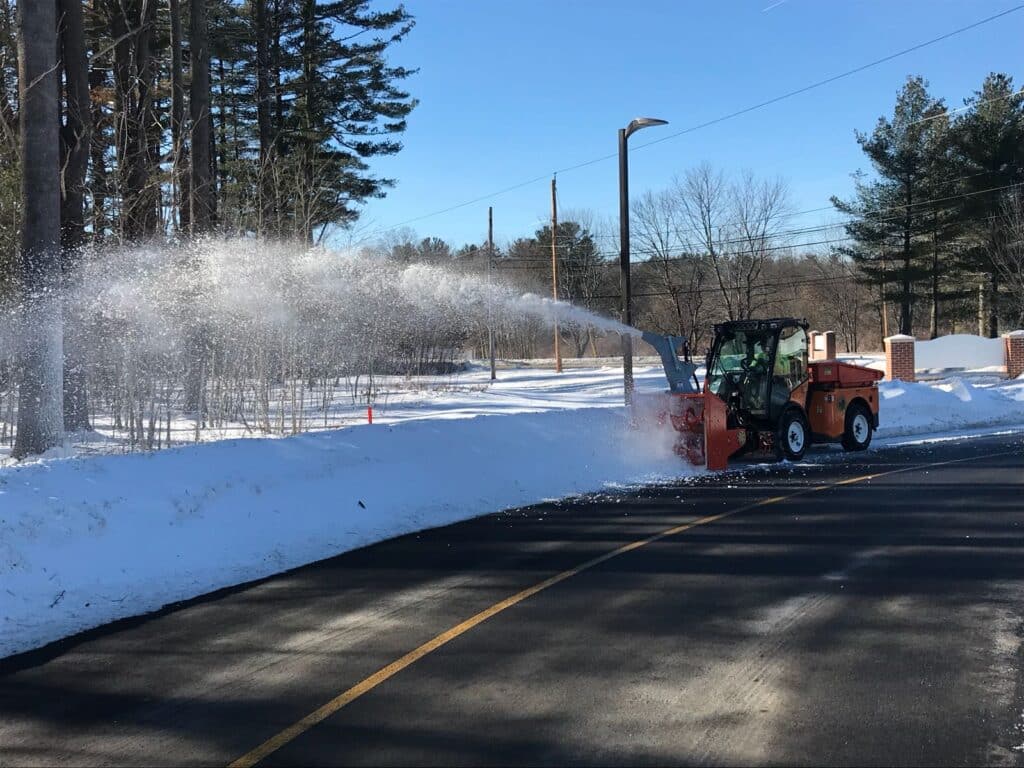
- Granular Spreaders: Sensors and calibrated controls adjust salt and sand distribution to match road conditions. Equipment such as granular spreaders ensure the right amount of material is applied.
- Liquid Anti-Icing Systems: These systems log application data to optimize timing and reduce waste. Leveraging the insights from liquid anti-icing systems—such as the Brine Masters™ Continuum™ Series—can significantly lower costs while minimizing environmental impact.
Layer 4: Weather and Pavement Intelligence Systems
Road Weather Information Systems (RWIS) combine hyper-local weather monitoring with pavement condition sensors—especially road-surface and air-temperature readings—to show when, where, and how conditions are changing. Paired with forecasts and treatment thresholds, this intelligence helps crews shift from reactive calls to precise, predictive decisions on timing and material use.
Layer 5: Integrated Data Platforms and Dashboards
Centralized dashboards consolidate data from all layers into a single interface. Real-time visualizations and detailed reports enable decision-makers to monitor fleet performance, material usage, and service outcomes. This integration supports continuous improvement and accountability, allowing for effective resource allocation during and after storms.
Mapping Technology to the Winter Workflow
Smart technology must integrate smoothly with daily operations. Municipalities can structure their winter management into three phases:
Pre-Storm Preparation
- Route Optimization: Use AVL analytics to design efficient plow routes that prioritize high-value areas.
- Material Staging: Rely on weather forecasts to pre-position salt, brine, and sand at strategic staging locations.
- Action Triggers: Employ pavement sensors to set thresholds for initiating de-icing treatments. This coordinated planning ensures material and workforce readiness before the storm hits.
During-Storm Execution
- Real-Time Monitoring: Live AVL data tracks vehicle positions, enabling dynamic route adjustments.
- Dynamic Adjustments: Telematics identifies equipment problems and material needs, prompting quick reassignments.
- Enhanced Coordination: Continuous data-sharing between central command and field crews ensures that evolving weather conditions are met with prompt, effective responses.
Post-Storm Analysis
- Service Verification: Data from AVL and application systems confirms route completions and material use, enabling teams to address gaps.
- Detailed Reporting: Dashboards compile key metrics—such as route times, material consumption, and vehicle uptime—to support evaluation and budget justification.
- Continuous Improvement: Historical data and performance benchmarks drive process refinement, ensuring that future operations become more efficient and responsive.
The KPI Scorecard: Measuring Success
Data is only valuable when it is translated into measurable outcomes. Municipalities should track key performance indicators (KPIs) in several areas:
Service Delivery
- Route Completion Time: Measure how quickly roads are cleared, with faster service indicating better efficiency.
- Emergency Response Time: Evaluate how promptly critical facilities, such as hospitals, maintain access during storms.
Material Stewardship
- Salt Usage per Event: Track salt and brine consumption relative to road mileage. Reduced usage with maintained safety indicates improved efficiency.
- Residual Material Levels: Monitor remaining materials after treatment to avoid overapplication and environmental harm.
- Material Reduction Over Time: Assess whether operator training and improved systems lead to a decline in material usage without compromising safety.
Fleet Performance
- Vehicle uptime: High operational percentages indicate better fleet management.
- Maintenance Efficiency: Balance routine maintenance against emergency repairs to ensure system reliability.
- Fuel efficiency: Analyze fuel consumption rates to gauge route optimization and overall operational efficiency.
Safety and Risk
- Accident Rates: Monitor incidents to ensure safe operations.
- Worker Incident Reports: Fewer injuries and near-misses reflect a well-managed operation with effective risk controls beyond standard PPE.
Implementation Roadmap
A phased approach helps municipalities modernize winter operations without disrupting day-to-day service. Each phase builds on the last—moving from visibility, to control, to true optimization.
Phase 1 (0–60 Days): Building Visibility
Implement AVL/GPS and a centralized dashboard to see where trucks are, what routes are being covered, and when key activities occur. Focus on getting clean, reliable data—not perfection.
Key actions:
- Install and configure AVL on priority vehicles and set up geofences for yards, routes, and critical facilities.
- Standardize route naming and basic operator/vehicle IDs so reporting is consistent.
- Establish baseline metrics (route completion time, lane-miles covered, idle time, material totals if available).
- Outcome: A shared “single view” of operations that improves dispatching, reduces overlap, and creates a defensible record of service.
Phase 2 (60–180 Days): Enhancing Control
Add material application controls (granular and/or liquid), then train crews so application rates and practices are consistent across operators and routes. Use early AVL insights to refine routing and coverage priorities.
Key actions:
- Calibrate spreaders/liquid systems and set initial target rates by route type and conditions.
- Build simple storm playbooks (anti-icing triggers, plowing priorities, escalation steps) tied to supervisor approvals.
- Coach operators using data (speed vs. spread rate, material use by route, overlap/rework indicators).
- Outcome: More consistent treatment quality, measurable reductions in waste, and fewer “it depends on who’s driving” outcomes.
Phase 3 (6–12 Months): Achieving Optimization
Integrate RWIS/weather and pavement intelligence with fleet and material data, and automate reporting so teams can move from reactive decisions to predictive ones. This is where the system starts recommending actions—not just recording them.
Key actions:
- Connect RWIS (road/air temps, pavement condition) and forecasts to define treatment thresholds and timing guidance.
- Automate data flows into reports for post-storm review, budget justification, and claims support.
- Implement exception-based alerts (equipment faults, abnormal spread rates, missed priority segments, rapid temp drops).
- Outcome: A coordinated, data-driven operation with faster decision-making, stronger accountability, and continuous improvement—demonstrating the full value of a modern municipal snow and ice management program from storm to storm.
Common Pitfalls and How to Overcome Them
Even the best smart winter-ops stack can fall short if it’s deployed without the right groundwork. Before you invest further, it helps to know the most common implementation pitfalls—from process gaps and data overload to durability and integration issues—and the practical steps municipalities can take to avoid them.
Pitfall #1: Technology Without Process Improvement
Adding AVL, material controls, or RWIS without updating routes, decision rules, and documentation often results in “new tools, same outcomes”—and limits ROI.
How to overcome it:
- Update SOPs to match the tools (who watches dashboards, who adjusts routes, who changes application rates).
- Define storm “playbooks” (anti-ice triggers, plowing priorities, escalation steps) and train to them.
- Start with 2–3 measurable process goals (e.g., reduce overlap, cut idle time, lower salt per lane-mile) and review after each event.
Pitfall #2: Data Overload
When every system generates maps, alerts, and reports, teams can get buried in numbers—leading to missed signals and slower decisions.
How to overcome it:
- Establish a short KPI set for the season (service time, lane-miles covered, salt per lane-mile, uptime, complaints).
- Use role-based views: supervisors get exceptions and alerts; managers get trend reports; operators get simple feedback.
- Turn data into action thresholds (e.g., “If road temp rises above X, switch strategy,” “If spread rate exceeds Y, notify supervisor”).
Pitfall #3: Operator Resistance
If technology feels like surveillance or extra work, adoption drops—especially when changes are rolled out quickly or without operator input.
How to overcome it:
- Involve operators early in device placement, cab workflow, and route logic—then incorporate their feedback.
- Emphasize “what’s in it for them”: fewer callbacks, clearer directions, safer decisions, less blame after storms.
- Organizations like the APWA offer winter maintenance certification programs that can support structured operator development.
Pitfall #4: Equipment Durability in Harsh Conditions
Vibration, corrosion, moisture, and extreme cold can damage sensors, wiring, and in-cab hardware—causing downtime and eroding trust in the system.
How to overcome it:
- Specify winter-rated hardware (sealed connectors, rugged tablets, protected harnessing, corrosion-resistant mounts).
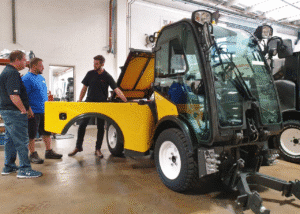
- Build a pre-season inspection checklist (calibration, firmware updates, cable checks, spare parts). Brown Equipment Company’s maintenance and repair services can help keep your fleet in top condition heading into winter.
- Keep spare parts on hand for high-failure items and set a fast swap process so trucks stay in service.
Pitfall #5: System Integration Challenges
When AVL, material controls, RWIS, and reporting live in separate portals, teams end up re-entering data, reconciling conflicting reports, and losing operational clarity.
How to overcome it:
- Prioritize platforms that integrate via API and can unify maps, routes, events, and reports. If your operation requires tailored configurations, explore custom builds and fabrication options.
- Decide early what your “system of record” is for routes, materials, and service verification.
- Run a phased integration: start with core fleet visibility, then add materials + RWIS, then automate reporting—testing each step before expanding fleetwide.
Frequently Asked Questions (FAQ)
What is “smart” snow and ice management?
Smart winter operations connect tools like AVL/GPS, telematics, material controls, RWIS, and reporting so municipalities can monitor work in real time, apply materials more precisely, and verify service after each event.
What does AVL mean in snowplow operations?
AVL stands for Automatic Vehicle Location. It uses GPS to show where trucks are, where they’ve been, and what they’re doing—helping reduce route overlap, improve coverage, and document service.
What is RWIS and how does it help municipalities?
RWIS stands for Road Weather Information System. It provides localized weather and pavement data—especially road-surface and air temperatures—to support better timing of anti-icing/de-icing and reduce unnecessary applications.
How do material application controls reduce salt use?
Controller-driven spreaders and liquid systems regulate application rates and log what was applied and where. That consistency helps prevent overapplication, improves operator coaching, and supports defensible reporting.
What’s the difference between anti-icing and de-icing?
Anti-icing is applied before snow/ice bonds to pavement to prevent buildup. De-icing is applied after snow/ice forms to break the bond and restore traction.
How can municipalities measure ROI on smart winter ops technology?
Common ROI drivers include reduced salt usage, fewer overtime hours, less route duplication, improved fleet uptime, and faster service verification. Track KPIs like salt per lane-mile, route completion time, and downtime to quantify results.
How long does it take to implement a smart snow and ice management program?
Many municipalities can implement basic fleet visibility in 0–60 days, add material controls and training in 60–180 days, and reach deeper optimization (RWIS integration, automation, advanced reporting) within 6–12 months.
Transforming Winter Operations: The Smart Approach to Snow & Ice Management
Transitioning to smart, data-driven municipal snow and ice management transforms how public works teams operate during winter storms. By leveraging technologies like AVL, innovative telematics, precise material controls, and integrated weather intelligence, municipal teams can achieve significant efficiency improvements, cost savings, and environmental benefits. This modern approach not only ensures safer roads and better resource use but also builds public trust through transparent, accountable operations.
If your municipality is ready to elevate its winter operations, Brown Equipment Company is here to help. Contact us today to learn more or schedule a free demonstration. Take the first step toward smarter, more sustainable snow and ice management—and see the difference a connected, efficient system can make for your community.